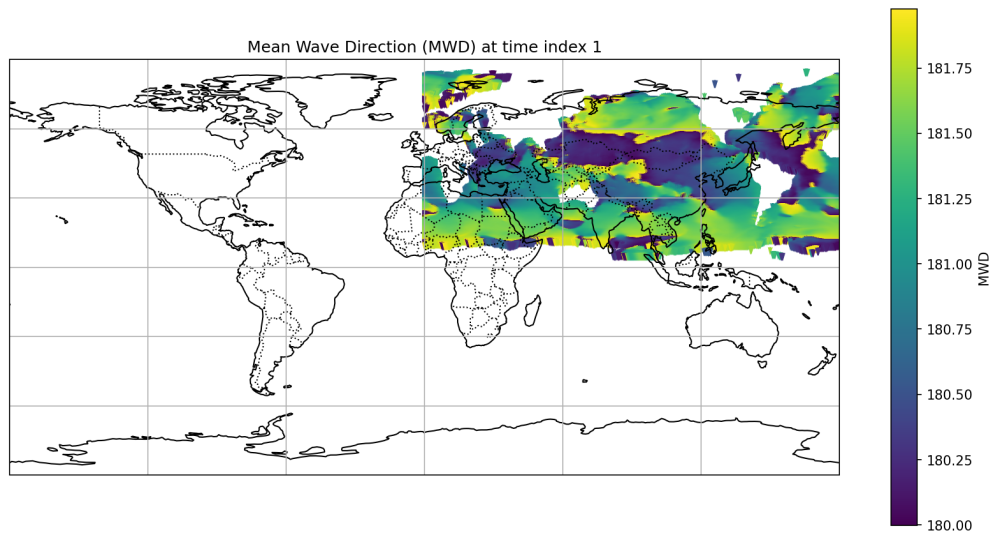
nina_99 Postado Julho 2, 2024 Denunciar Share Postado Julho 2, 2024 (editado) Link do arquivo nc: https://drive.google.com/uc?export=download&id=1wykhadrVHP2I-nqlrfpNd3kQ0ErUoYxh import netCDF4 as nc import numpy as np import matplotlib.pyplot as plt import cartopy.crs as ccrs import cartopy.feature as cfeature # Open NetCDF file nc_file = '/content/drive/MyDrive/rs4/adaptor.mars.internal-1719616919.4771404-4624-16-f31563f3-4d1d-4422-820c-3ca7cd9b2e78.nc' dataset = nc.Dataset(nc_file, 'r') # Extract longitude, latitude, and time variables lon_var = dataset.variables['longitude'][:] lat_var = dataset.variables['latitude'][:] time_var = dataset.variables['time'] mwd_var = dataset.variables['mwd'] # Define the time index to plot time_idx = 1 # Adjust according to your specific time index # Extract the mwd data for the specified time index mwd_data = mwd_var[time_idx, :, :] # Check for missing values missing_value = mwd_var._FillValue if '_FillValue' in mwd_var.ncattrs() else None if missing_value is not None: print(f"Missing value representation: {missing_value}") # Replace missing values with NaN mwd_data = np.where(mwd_data == missing_value, np.nan, mwd_data) # Apply scale factor and add offset if needed scale_factor = mwd_var.scale_factor if 'scale_factor' in mwd_var.ncattrs() else 1.0 add_offset = mwd_var.add_offset if 'add_offset' in mwd_var.ncattrs() else 0.0 mwd_data = mwd_data * scale_factor + add_offset # Print the range of the data to verify print(f"MWD data range: min={np.nanmin(mwd_data)}, max={np.nanmax(mwd_data)}") # Ensure the data values are within a reasonable range (0 to 360 degrees) mwd_data = np.where((mwd_data >= 0) & (mwd_data <= 360), mwd_data, np.nan) # Create U and V components of the wave direction # Assuming MWD (mean wave direction) is in degrees from North mwd_rad = np.deg2rad(mwd_data) U = np.sin(mwd_rad) V = np.cos(mwd_rad) # Plot the wave direction as quivers on a global map plt.figure(figsize=(14, 7), dpi=150) ax = plt.axes(projection=ccrs.PlateCarree()) ax.set_global() ax.coastlines() ax.add_feature(cfeature.BORDERS, linestyle=':') ax.gridlines() # Plot the quivers quiver = ax.quiver(lon_var, lat_var, U, V, mwd_data, transform=ccrs.PlateCarree(), scale=100, cmap='viridis') plt.colorbar(quiver, ax=ax, label='MWD') plt.title(f'Mean Wave Direction (MWD) at time index {time_idx}') plt.xlabel('Longitude') plt.ylabel('Latitude') plt.show() # Close the NetCDF dataset dataset.close() Editado Julho 2, 2024 por nina_99 Citar Link para o comentário Compartilhar em outros sites More sharing options...
1 ArteEN Postado Julho 2, 2024 Denunciar Share Postado Julho 2, 2024 não da para analisar pois não temos acesso aos dados Citar Link para o comentário Compartilhar em outros sites More sharing options...
0 nina_99 Postado Julho 2, 2024 Autor Denunciar Share Postado Julho 2, 2024 Obrigada, adicionei o link para baixar o arquivo. Citar Link para o comentário Compartilhar em outros sites More sharing options...
0 ArteEN Postado Julho 2, 2024 Denunciar Share Postado Julho 2, 2024 sem acesso a pagina do arquivo, pode tentar colocar o arquivo em outro lugar Citar Link para o comentário Compartilhar em outros sites More sharing options...
0 nina_99 Postado Julho 2, 2024 Autor Denunciar Share Postado Julho 2, 2024 Boa tarde, atualizei o link:https://drive.google.com/uc?export=download&id=1wykhadrVHP2I-nqlrfpNd3kQ0ErUoYxh Citar Link para o comentário Compartilhar em outros sites More sharing options...
0 ArteEN Postado Julho 2, 2024 Denunciar Share Postado Julho 2, 2024 tentei ver o problema, no codigo em si não vejo erros, acho que é um problema com os dados que estão em escala menor , assim tentei fazer a seguinte alteração lon_var = dataset.variables['longitude'][:] * 2 lat_var = dataset.variables['latitude'][:] * 2 -90 é a alteração correta? não sei, só que o resultado visual começa a fazer sentido Citar Link para o comentário Compartilhar em outros sites More sharing options...
Pergunta
nina_99
Link do arquivo nc:
https://drive.google.com/uc?export=download&id=1wykhadrVHP2I-nqlrfpNd3kQ0ErUoYxh

Editado por nina_99Link para o comentário
Compartilhar em outros sites
5 respostass a esta questão
Posts Recomendados
Participe da discussão
Você pode postar agora e se registrar depois. Se você já tem uma conta, acesse agora para postar com sua conta.