

Lucass Zek
-
Total de itens
7 -
Registro em
-
Última visita
Sobre Lucass Zek

Lucass Zek's Achievements
0
Reputação
-
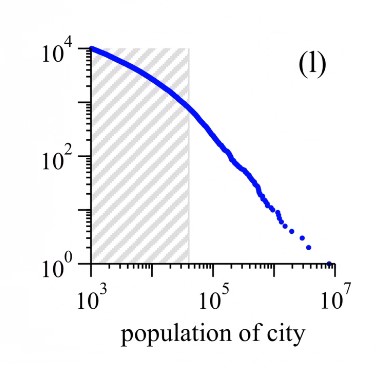
Preciso destacar uma certa região no gráfico como ta na imagem, como faço isso no matplotlib
-

Dúvidas sobre estética de gráficos python
uma questão postou Lucass Zek Repositório de scripts - Python
Olá eu tenho um certo data set e quero simplesmente circular um ponto específico no gráfico como na imagem, como eu faço isso no matplotlib


-
Estou com o seguinte programa para rodar N_0 = input('Give initial population size N_0: ') r = input('Give net growth rate r: ') dt = input('Give time step size: ') N_t = input('Give number of steps: ') t = np.linspace(0, (int(N_t)+1)*int(dt), int(N_t)+2) N = np.zeros(int(N_t)+2) N[0] = N_0 for n in range(int(N_t)+1): N[int(n)+1] = N[int(n)] + int(r)*int(dt)*N[int(n)] import matplotlib.pyplot as plt numerical_sol = 'bo' if int(N_t) < 70 else 'b-' plt.plot(t, N, numerical_sol, t, N_0*np.exp(r*t), 'r-') plt.legend(['numerical', 'exact'], loc='upper left') plt.xlabel('t'); plt.ylabel('N(t)') filestem = 'growth1_%dsteps' % N_t plt.savefig('%s.png' % filestem); plt.savefig('%s.pdf' % filestem) e está dando o seguinte erro: ---> 14 plt.plot(t, N, numerical_sol, t, N_0*np.exp(r*t), 'r-') 15 plt.legend(['numerical', 'exact'], loc='upper left') 16 plt.xlabel('t'); plt.ylabel('N(t)') UFuncTypeError: ufunc 'multiply' did not contain a loop with signature matching types (dtype('<U32'), dtype('<U32')) -> dtype('<U32') alguém sabe como solucionar
-
Erro = can only concatenate str (not "int") to str
pergunta respondeu ao Lucass Zek de Lucass Zek em Python
Muito obrigado -
Erro = can only concatenate str (not "int") to str
pergunta respondeu ao Lucass Zek de Lucass Zek em Python
não, eu sou leigo em python não sei quase nada -
Erro = can only concatenate str (not "int") to str
pergunta respondeu ao Lucass Zek de Lucass Zek em Python
Sabe como eu possa corrigir isso para que possa somar? -
Lucass Zek se registrou na comunidade
-
Estou com problema no linspace, da o seguinte erro na linha can only concatenate str (not "int") to str N_0 = input('Give initial population size N_0: ') r = input('Give net growth rate r: ') dt = input('Give time step size: ') N_t = input('Give number of steps: ') t = linspace(0, (N_t+1)*dt, N_t+2) N = zeros(N_t+2) N[0] = N_0 for n in range(N_t+1): N[n+1] = N[n] + r*dt*N[n] import matplotlib.pyplot as plt numerical_sol = 'bo' if N_t < 70 else 'b-' plt.plot(t, N, numerical_sol, t, N_0*exp(r*t), 'r-') plt.legend(['numerical', 'exact'], loc='upper left') plt.xlabel('t'); plt.ylabel('N(t)') filestem = 'growth1_%dsteps' % N_t plt.savefig('%s.png' % filestem); plt.savefig('%s.pdf' % filestem)